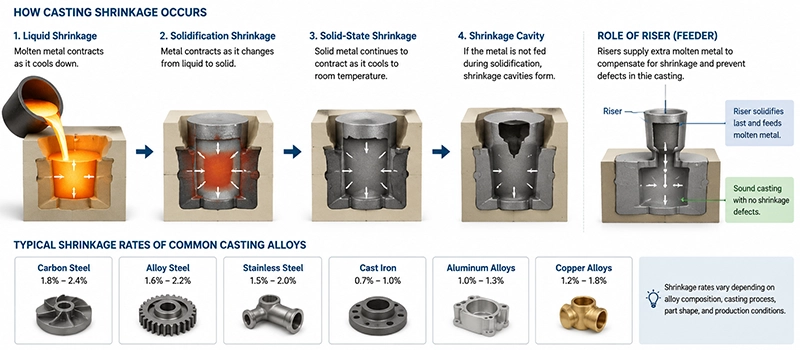
Understanding the casting shrinkage of alloys is essential when designing patterns, molds, and tooling for metal castings. Every alloy contracts as it cools, but the amount of contraction varies depending on its chemical composition and metallurgical properties. Because of these differences, the casting shrinkage of alloys must always be considered before production begins to ensure the final casting meets the required dimensions.
There is no universal shrinkage value that applies to every material. Instead, each alloy has its own typical shrinkage range developed through industry standards and manufacturing experience. In addition, the actual casting shrinkage of alloys may vary depending on the casting process, mold material, cooling conditions, pouring temperature, and part geometry.
The following table provides typical casting shrinkage rates for many of the alloys commonly used in modern foundries. These values are intended as general engineering references and may vary according to specific manufacturing conditions.
| Alloy | Typical Shrinkage Rate |
|---|---|
| Carbon Steel | 2.0% – 2.6% |
| Low Alloy Steel | 2.0% – 2.5% |
| High Alloy Steel | 2.0% – 2.4% |
| Stainless Steel 304 | 2.0% – 2.3% |
| Stainless Steel 304L | 2.0% – 2.3% |
| Stainless Steel 316 | 2.0% – 2.3% |
| Stainless Steel 316L | 2.0% – 2.3% |
| Stainless Steel 410 | 1.9% – 2.2% |
| Stainless Steel 420 | 1.9% – 2.2% |
| 17-4 PH Stainless Steel | 2.0% – 2.3% |
| Duplex Stainless Steel | 2.0% – 2.3% |
| Gray Cast Iron | 0.8% – 1.3% |
| Ductile Iron | 1.0% – 1.8% |
| Malleable Iron | 1.0% – 1.6% |
| Aluminum Alloys | 1.2% – 1.8% |
| ADC12 Aluminum Alloy | 1.0% – 1.4% |
| A356 Aluminum Alloy | 1.2% – 1.5% |
| Brass | 1.3% – 1.8% |
| Bronze | 1.5% – 2.0% |
| Copper | 1.8% – 2.1% |
| Zinc Alloys | 0.7% – 1.3% |
| Magnesium Alloys | 1.2% – 1.6% |
| Nickel Alloys | 2.0% – 2.5% |
| Cobalt Alloys | 2.0% – 2.4% |
Why Do Shrinkage Rates Differ?
The casting shrinkage of alloys differs because every metal has its own chemical composition, crystal structure, melting temperature, and coefficient of thermal expansion. These material characteristics determine how much volume is lost as the alloy cools from a molten state to room temperature.
For example, steel alloys generally experience greater casting shrinkage of alloys than cast irons, while aluminum alloys typically shrink less than stainless steels. Even alloys within the same material family can exhibit slight differences due to variations in alloying elements and manufacturing conditions.
Using Casting Shrinkage Data in Production
Foundries use casting shrinkage of alloys data primarily during pattern and tooling design. Engineers calculate the appropriate shrinkage allowance before production so that the finished casting reaches the specified dimensions after cooling and solidification.
Although standard shrinkage values provide an excellent starting point, experienced foundries often adjust shrinkage allowances based on their own production data, casting process, component geometry, and material behavior. This practical approach helps improve dimensional accuracy, reduce machining requirements, and achieve consistent casting quality across different production batches.